USDJPY Carves A Potential Bottom Around 104.00
23 September 2020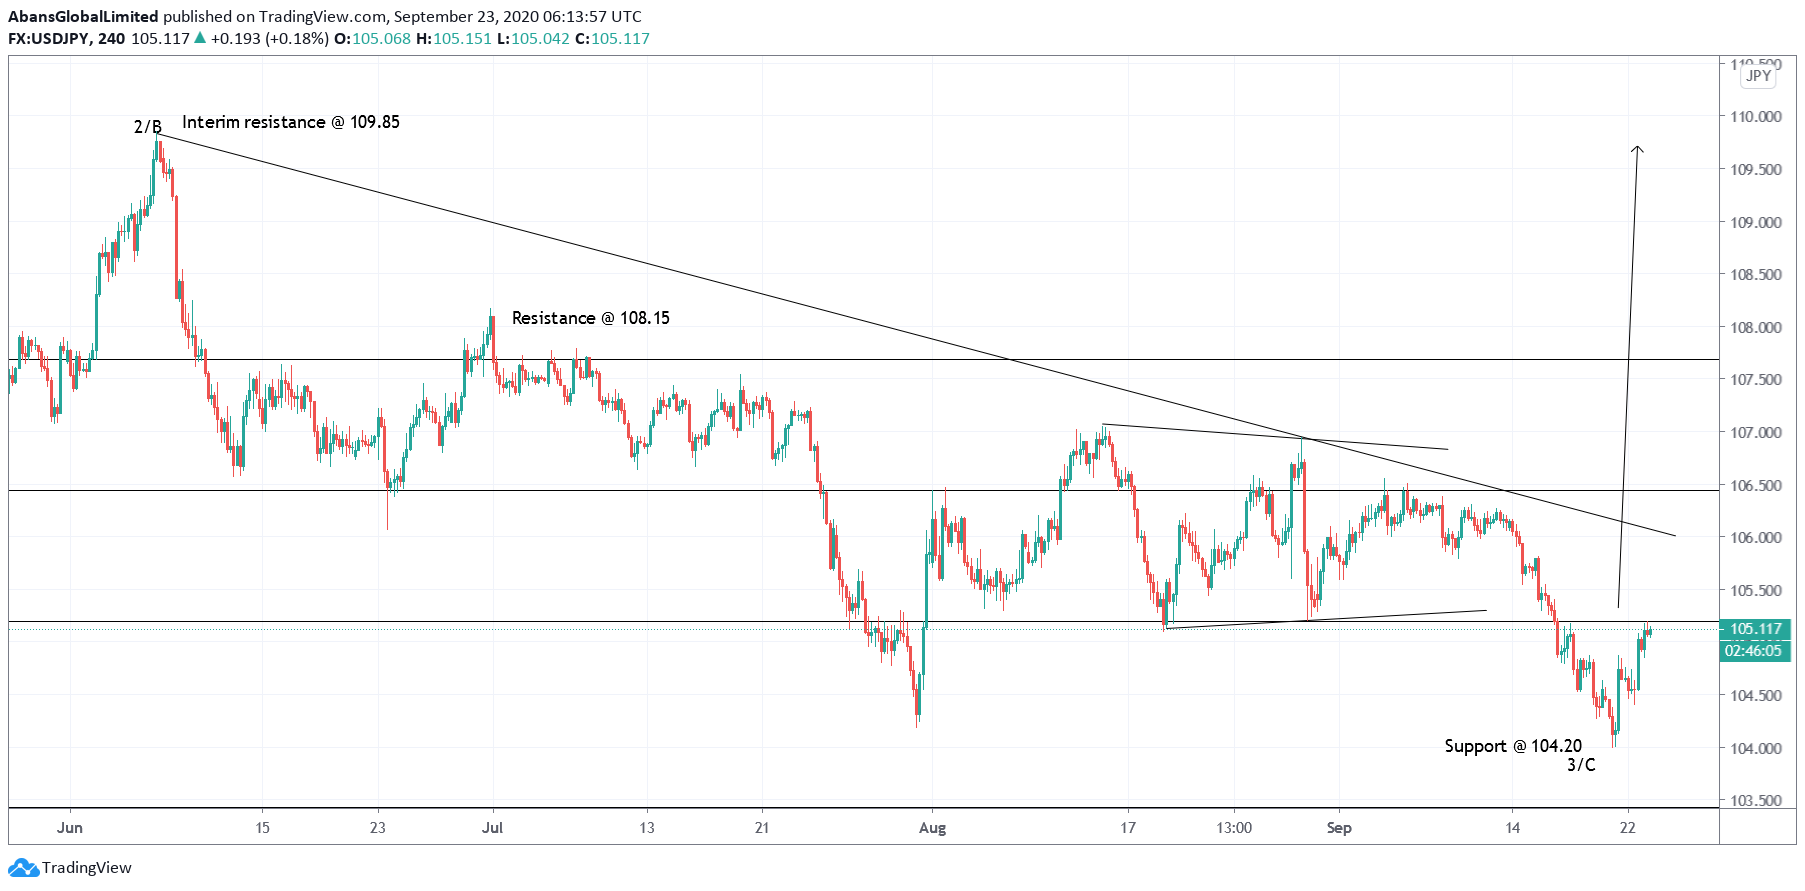
USDJPY seems to have carved a potential bottom around 104.00 levels yesterday, just a few pips below the previous swing lows at 104.20. This could be marked as a double bottom as well, which indicates potential bullish reversal ahead. Bulls are expected to remain in control from here on.
USDJPY potential wave structure is as follows: The currency had dropped through 101.18 lows early March 2020, followed by a rally towards 111.75 levels. This could be marked as Wave A or 1, which should be exceeded going further.
The subsequent drop from 111.75 through 104.00 is a corrective structure, marked as Wave B or 2 on the chart here. The above unfolded as 3-3-5, where Wave C unfolded as a potential ending diagonal sub dividing into 5 waves.
Also note that USDJPY has found support around 120 pips below the fibonacci 0.618 retracement of the entire rally between 101.18 and 111.75 respectively, which is seen towards 105.20 levels. Probability for a bullish reversal from here remains high.
Immediate resistance is seen through 106.50 mark, while support is around 101.18 levels respectively. A break above 106.50 would confirm that bulls are back in control and are here to stay for long. Also note that prices would be breaking above the resistance trend line as well.
Trader might be willing to initiate fresh long positions between 104.50/105.00 potential support zone, with protective stops below 104.00 mark and projected targets above 106.50, 108.00 and 109.85 respectively.
Prepared by
Technical Analysis Team
Trade with
Abans Global
- Authorised and Regulated by FCA
- Customer Support 24/5
- Low Spread & Commission
- Instant Execution
- No Dealing Desk